9137: Inference
内存限制:256 MB
时间限制:8 S
题面:传统
评测方式:文本比较
上传者:
提交:1
通过:1
题目描述
Given m features, you want to infer the last feature's value of Alice by the value of her first m − 1 features, based on massive data.
The relationship between features can be represented as a directed acyclic graph, where a node A pointing to a node B indicates that B is a random variable dependent on A.
The following formula can calculate the probability of the last feature's value of Alice based on other data, in which x i represents the i−th feature, π(xi) represents nodes that point to xi, and cnt represents their number of occurrences:
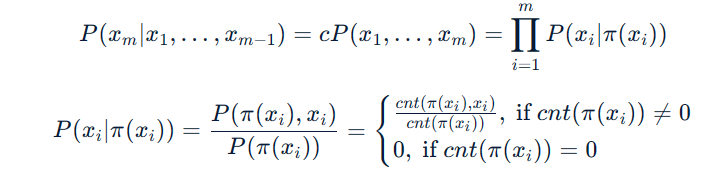
It is guaranteed that the last feature has zero out-degree, and there exists at least one case of value such that cnt(π(xi)) ̸= 0.
Now, given n people's data, what is the most likely value of the m−th feature of Alice, given the value of her first m − 1 features.
The relationship between features can be represented as a directed acyclic graph, where a node A pointing to a node B indicates that B is a random variable dependent on A.
The following formula can calculate the probability of the last feature's value of Alice ba
It is guaranteed that the last feature has zero out-degree, and there exists at least one case of value such that cnt(π(xi)) ̸= 0.
Now, given n people's data, what is the most likely value of the m−th feature of Alice, given the value of her first m − 1 features.
输入格式
At the beginning of the input section, there is an integer T(1 ≤ T ≤ 10), indicating the number of test cases.
For every test case, the first line consists of three integers n(1 ≤ n ≤ 104), m(1 ≤ m ≤ 100),k(1 ≤ k ≤ 300), indicating the number of data, the number of features, and the number of the relationship between the features.
In the next k rows, each row contains two integers x, y(1 ≤ x, y ≤ m), indicating node x point to node y, thus y−th feature is dependent on x−th feature. Every point has an in-degree less than 5.
In the next n rows, each row contains m integers indicating one person's values of each feature.Every feature’s value is among 0, 1, 2.
In the last line, there are m − 1 integers indicating Alice's values of the first m − 1 features.
输出格式
An integer denoting the most probable value of Alice's m−th feature.
It is guaranteed that there exists only 1 value which has the biggest probability.
It is guaranteed that there exists only 1 value which has the biggest probability.
输入样例 复制
1
10 5 4
1 4
2 4
3 5
4 5
0 1 0 1 0
0 1 1 1 1
0 0 0 0 0
0 0 1 0 0
1 1 1 0 1
1 0 0 1 1
1 1 0 1 1
1 0 1 0 0
1 1 1 1 1
0 1 0 1 1
1 1 0 0
输出样例 复制
0数据范围与提示
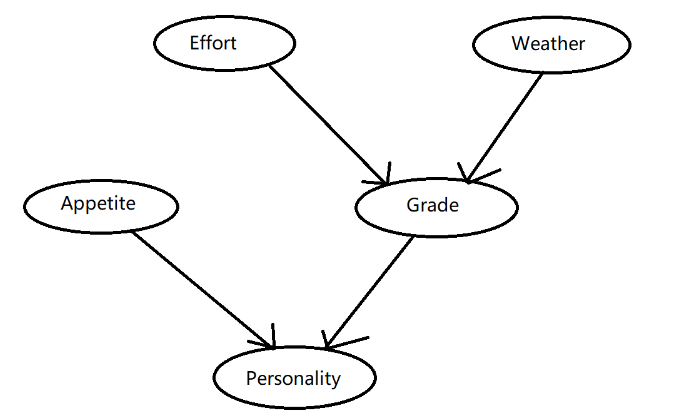
In the example, there are 10 people's data, 5 features, and 4 edges between the features. The table of data is shown in the following table.

The relation between features is shown in the following graph.
To calculate the possibility that the 5-th feature has a value 0 in the last line of data, we use the formula:
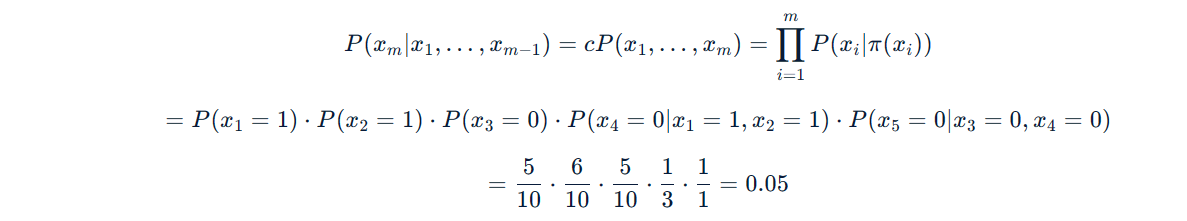
The possibility that the 5−th feature has a value 1 or 2 is 0, which is less than 0.05. So we take 0 as the value of 5-th feature.
The relation between features is shown in the following graph.
To calculate the possibility that the 5-th feature has a value 0 in the last line of data, we use the formula:
The possibility that the 5−th feature has a value 1 or 2 is 0, which is less than 0.05. So we take 0 as the value of 5-th feature.